Lesson 4 Visualize: ggplot2, plotly, tmap
4.1 Plot
Inspiring people:
Hadley Wickham: grammar of graphics
Hans Rosling: Gapminder

Gapminder World - Wealth & Health of Nations


4.1.1 Static: ggplot
4.1.1.1 Scatterplot
library(dplyr)
library(ggplot2)
library(gapminder)

# preview data
gapminder

# get range of available data
summary(gapminder)
# setup dataframe
g = gapminder %>%
filter(year==2007) %>% # most recent year
mutate(pop_m = pop/1e6) # population, millions
# plot scatterplot of most recent year
s = ggplot(g, aes(x=gdpPercap, y=lifeExp)) +
geom_point()
s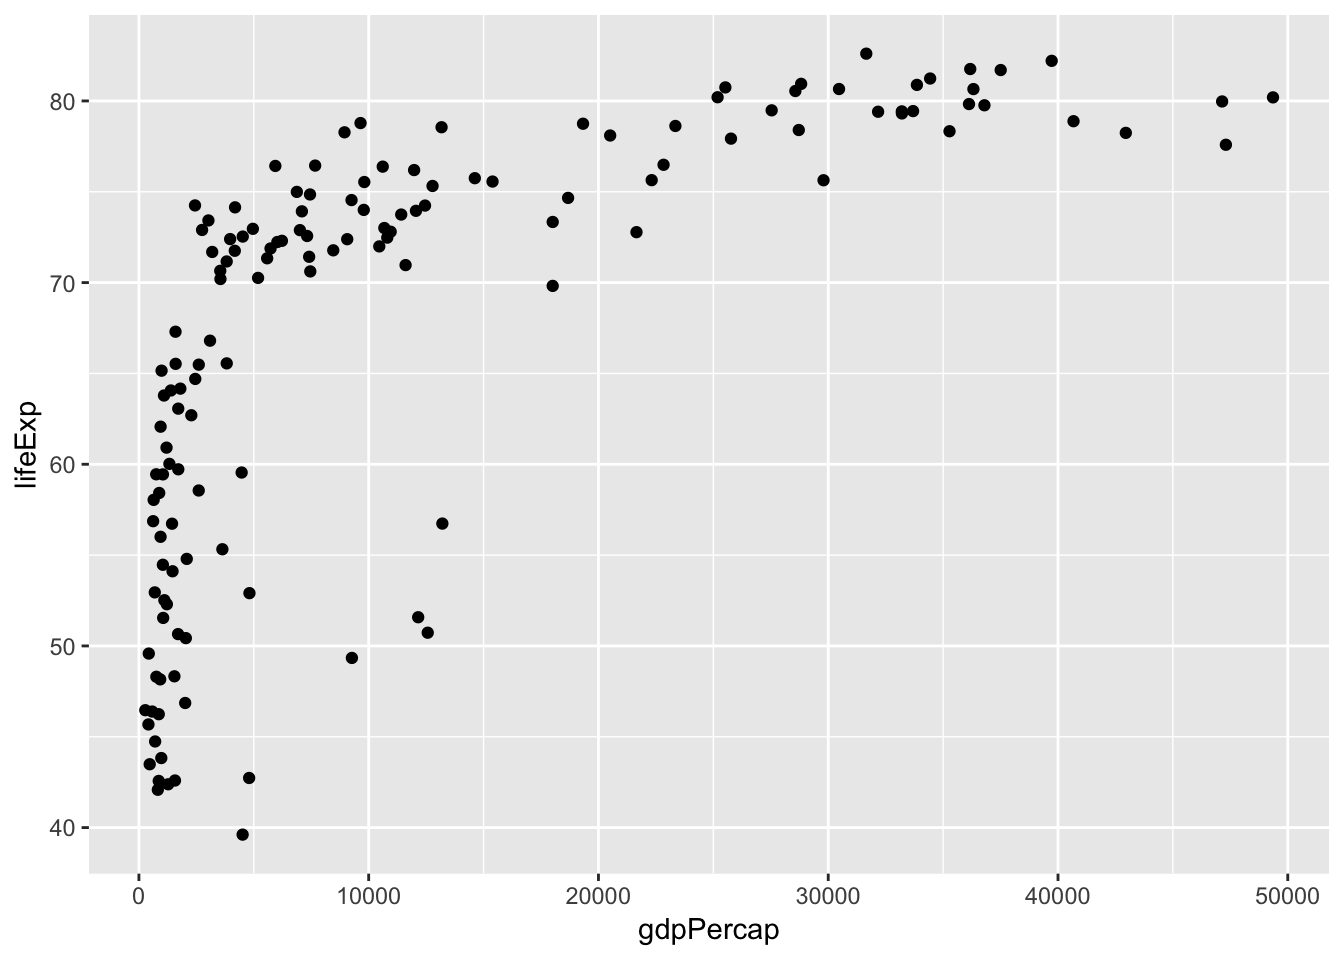
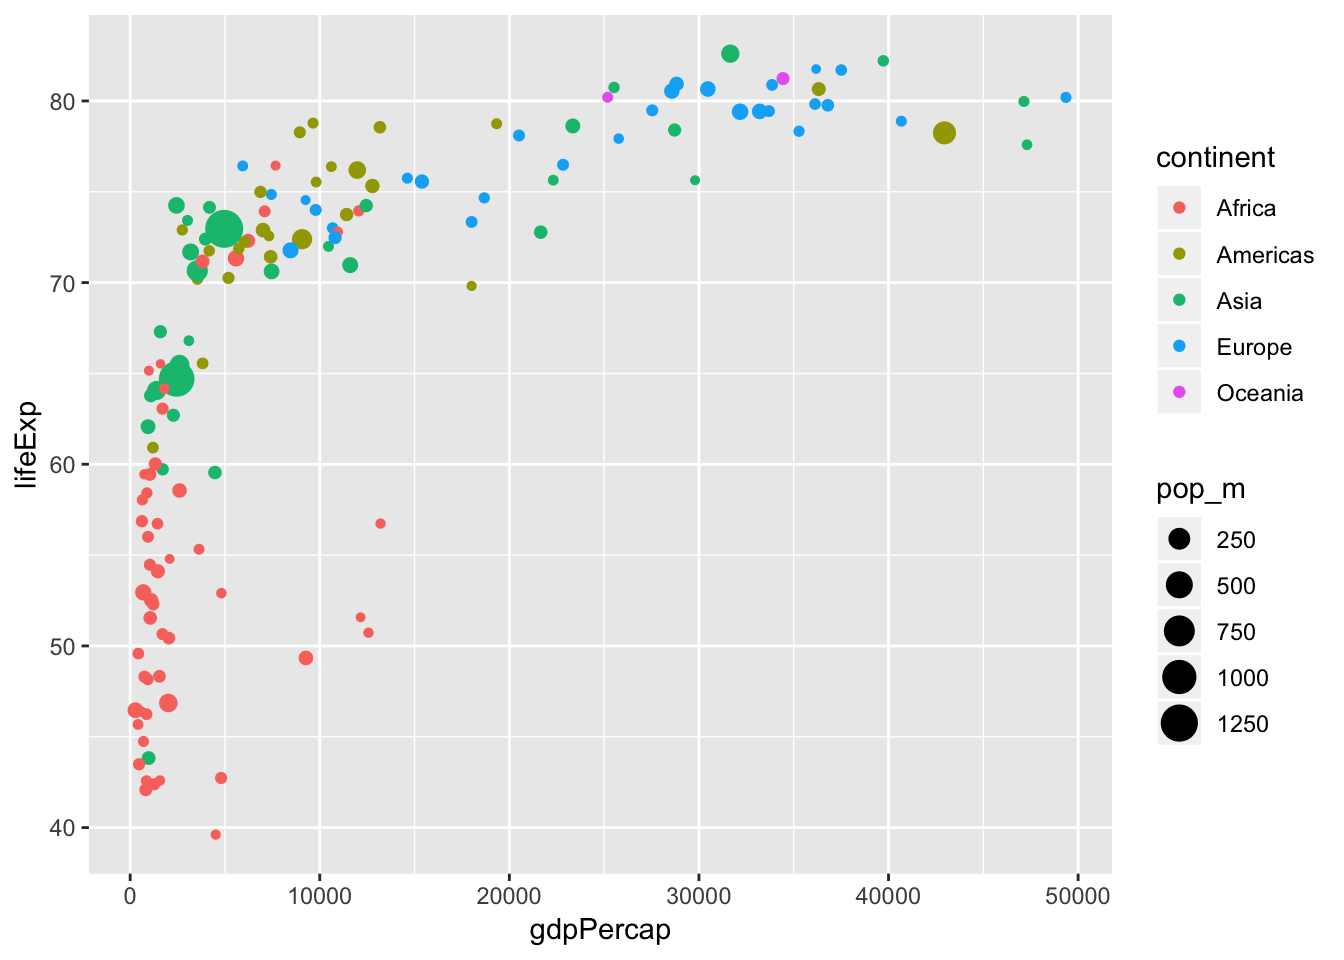
# add title, update axes labels
s = s +
  ggtitle('Health & Wealth of Nations for 2007') +
  xlab('GDP per capita ($/year)') +
  ylab('Life expectancy (years)')
s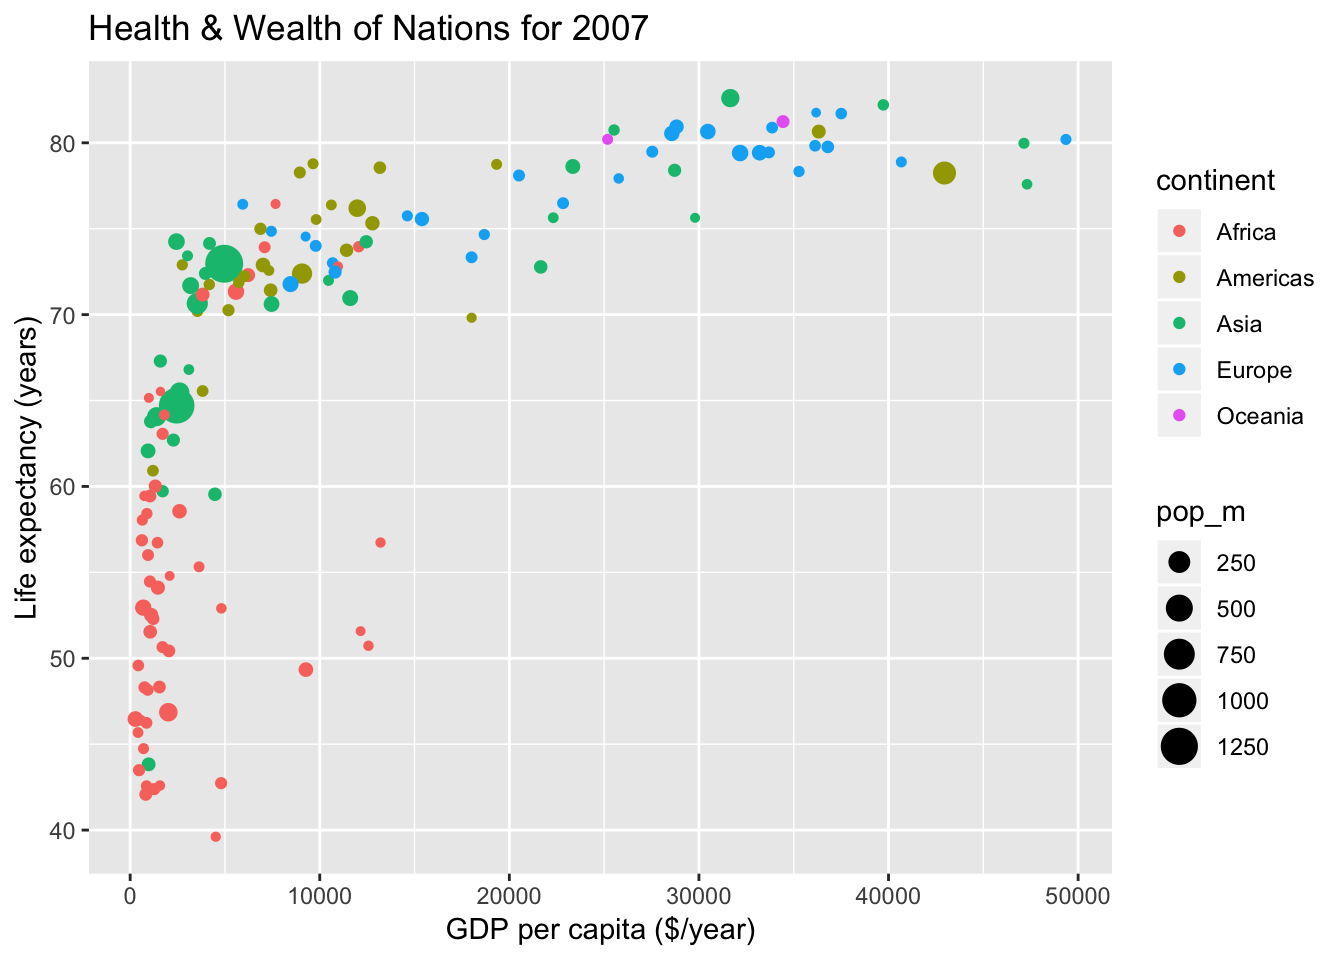
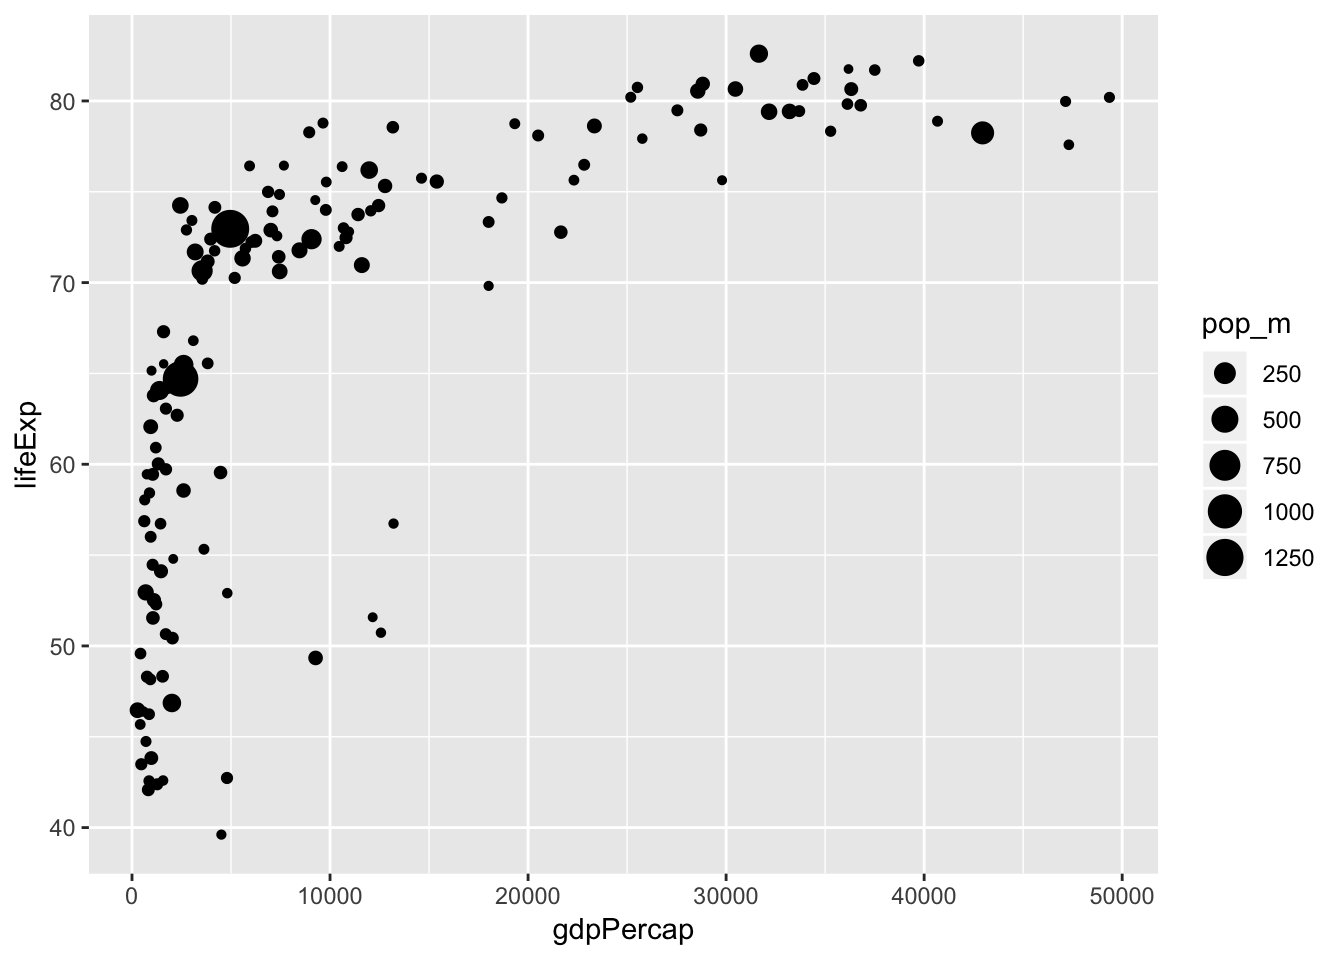
# label legend
s = s +
  scale_colour_discrete(name='Continent') +
  scale_size_continuous(name='Population (M)')
s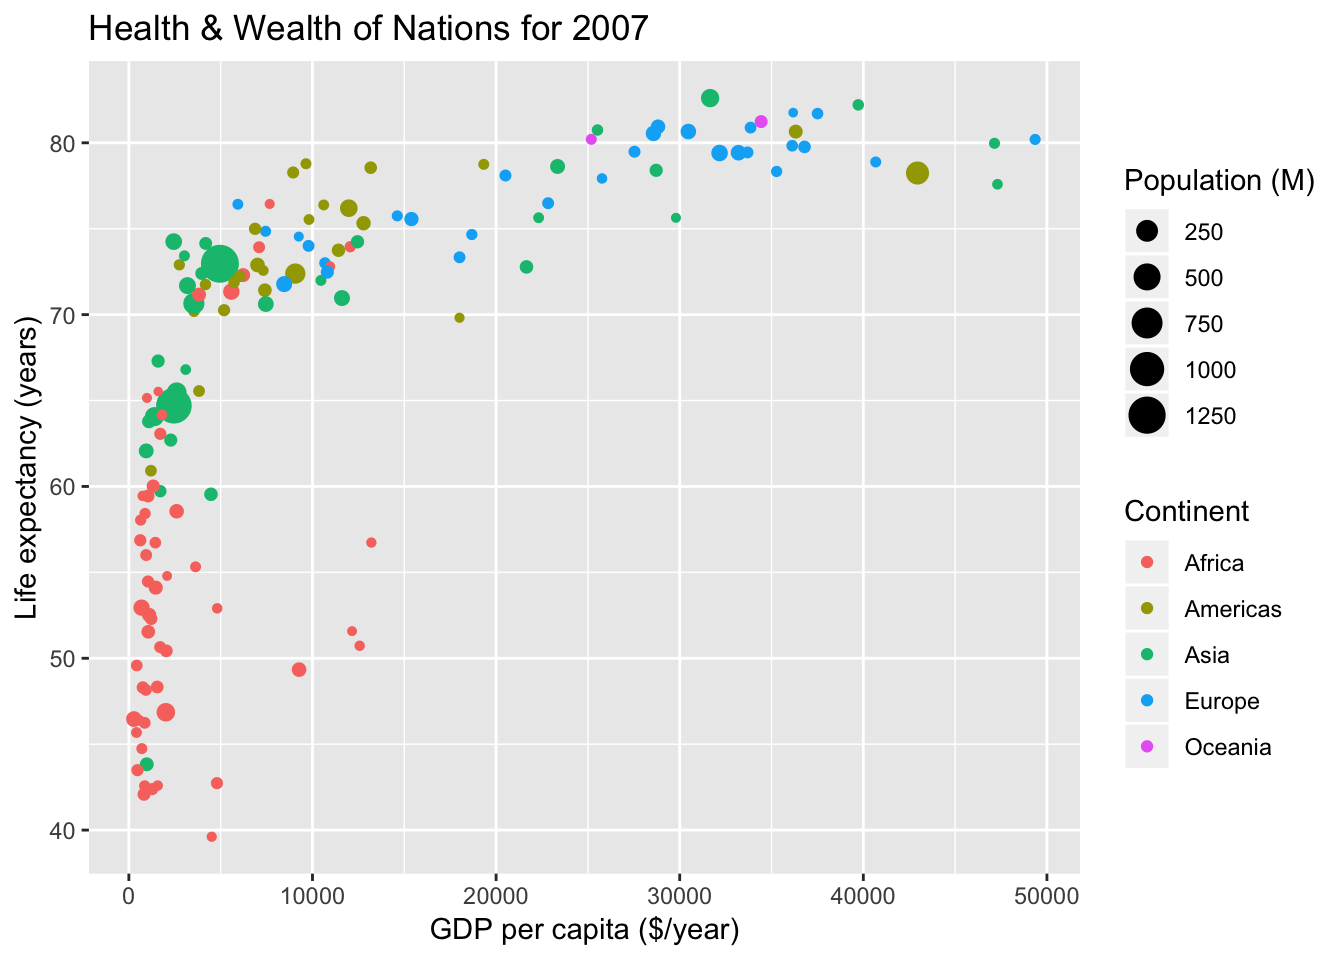
Your Turn
Now with country emissions datasets…
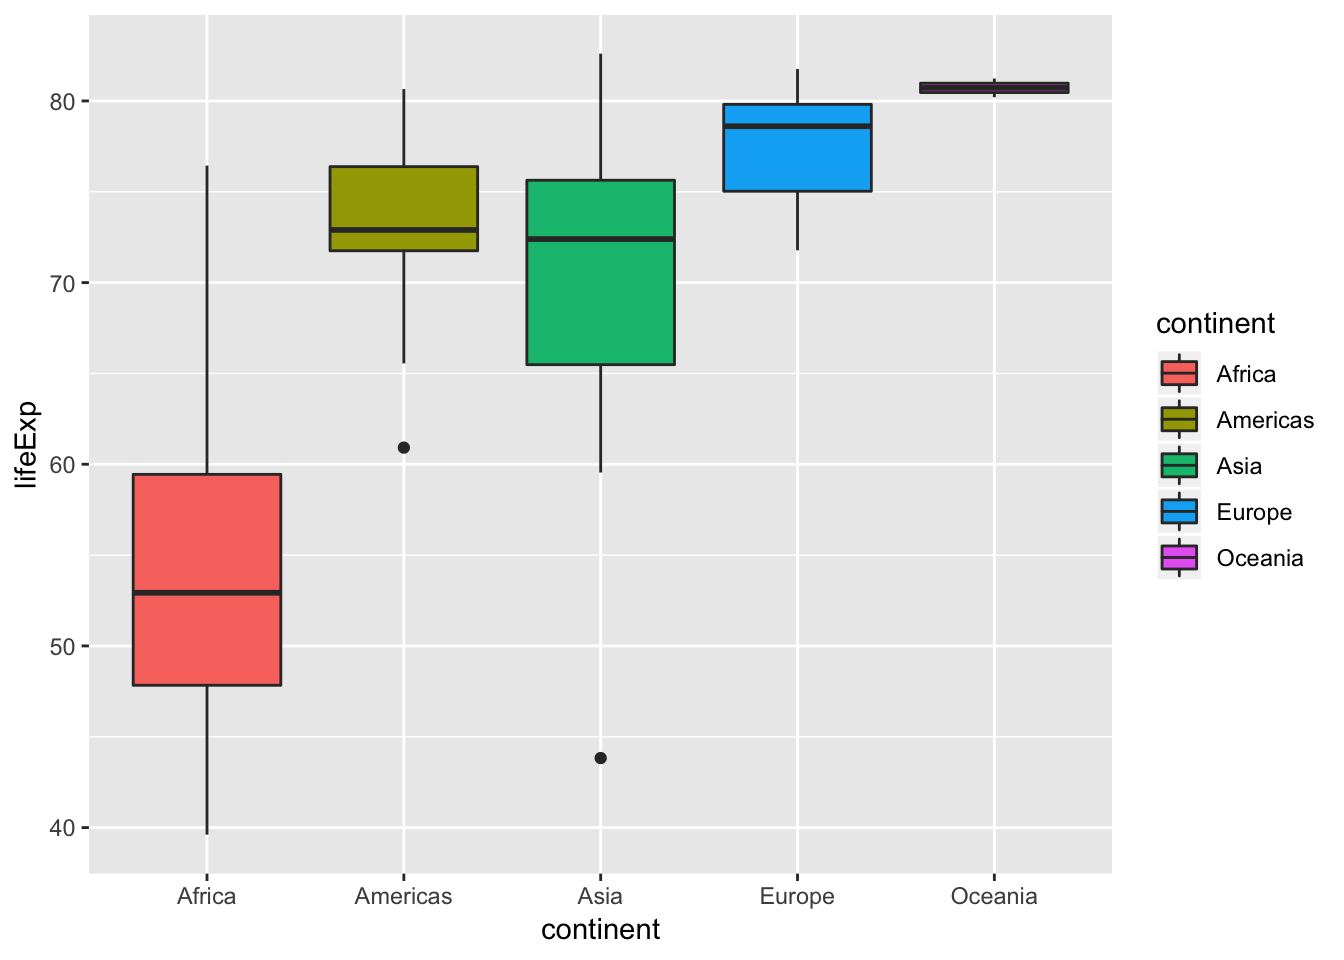
4.1.1.2 Boxplot
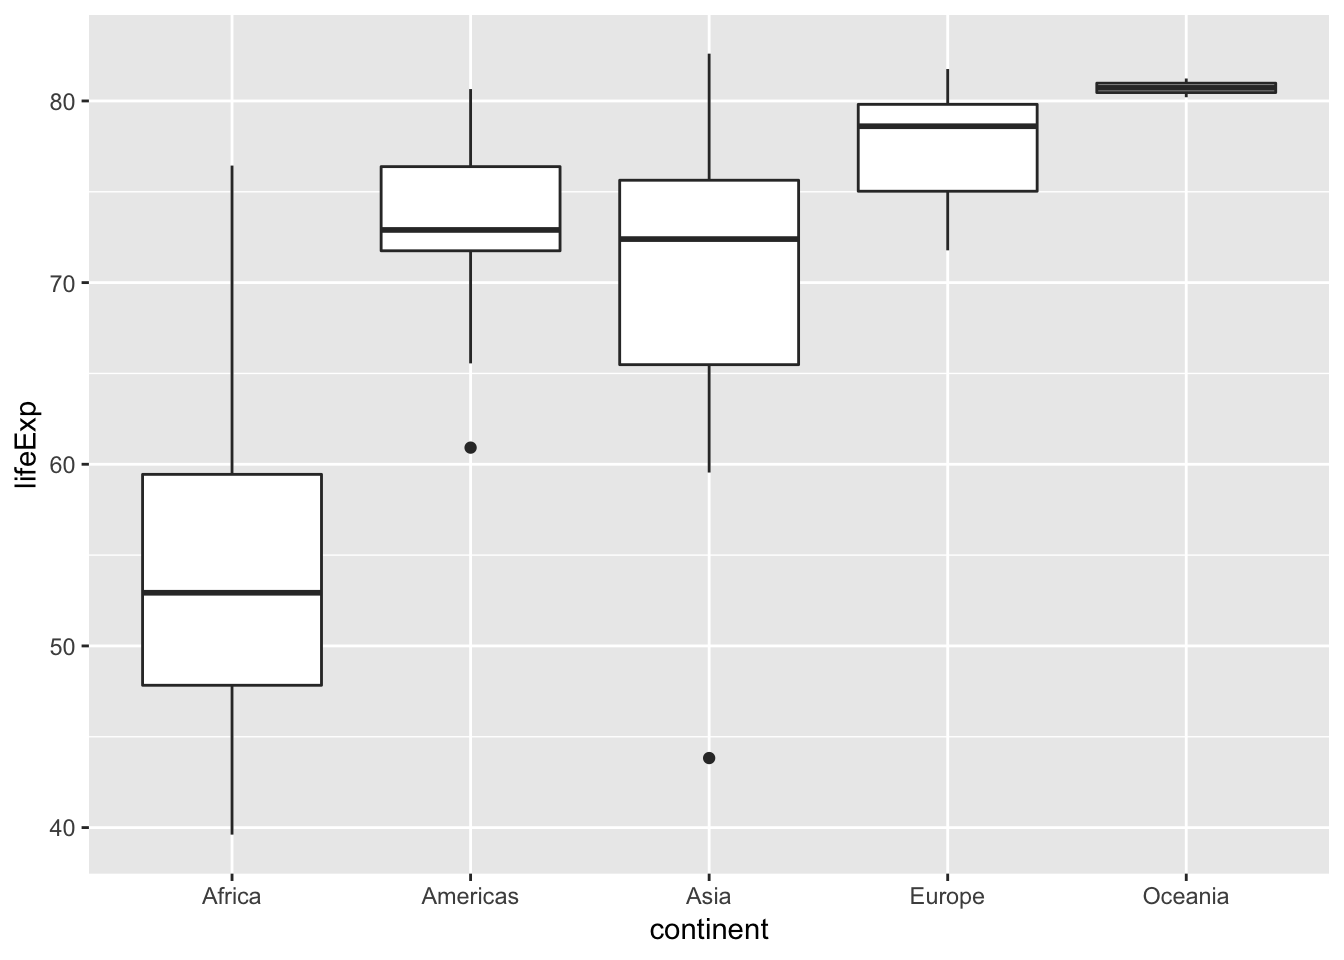
# drop legend, add title, update axes labels
b = b +
  theme(legend.position='none') +
  ggtitle('Life Expectancy by Continent for 2007') +
  xlab('Continent') +
  ylab('Life expectancy (years)')
b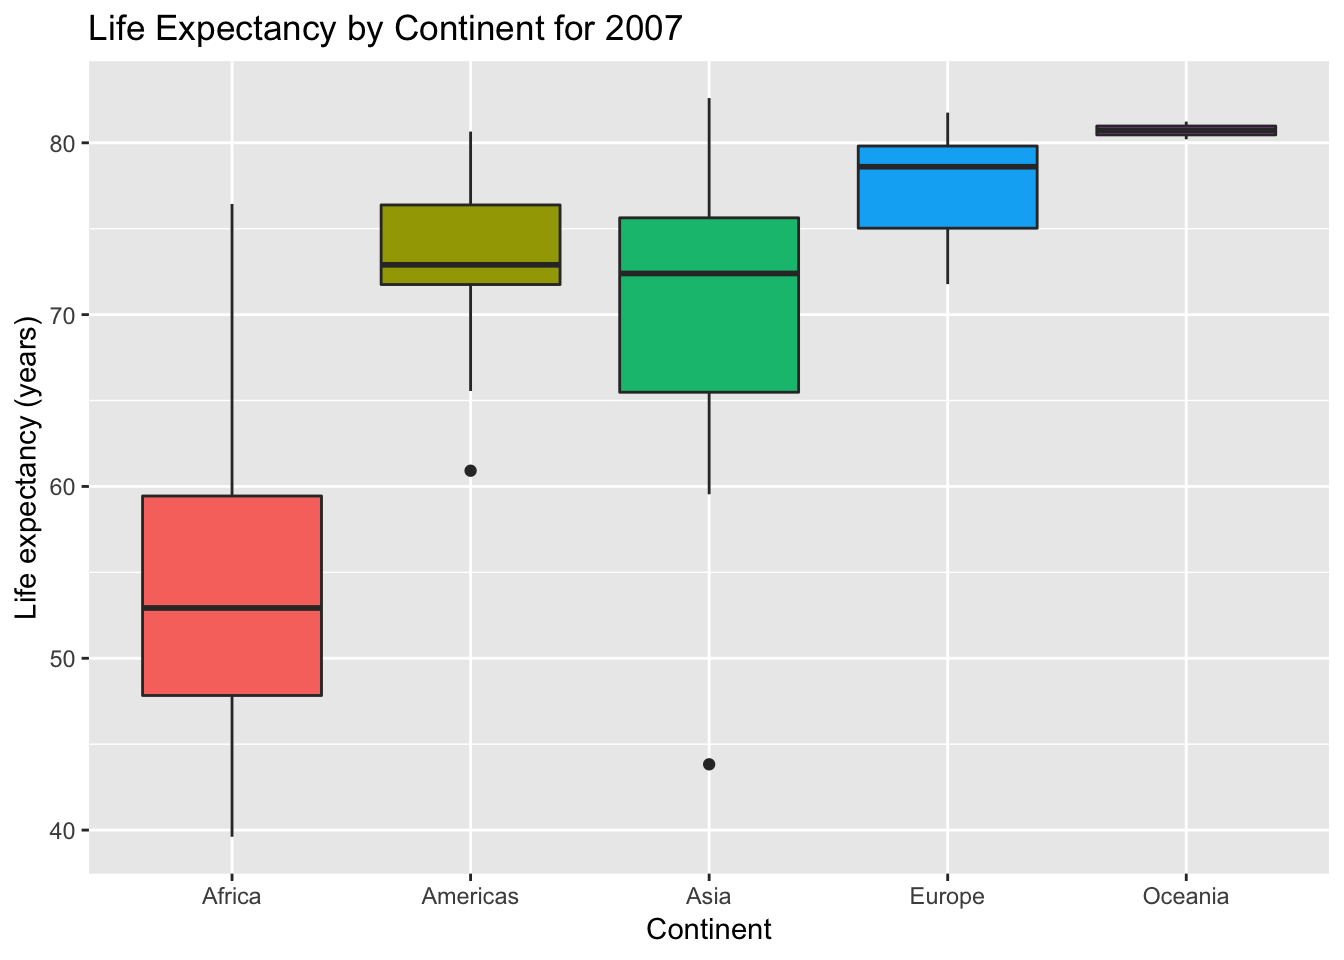
Your Turn: Make a similar plot but for gdpPercap. Be sure to update the plot’s aesthetic, axis label and title accordingly.
4.1.2 Interactive: plotly
library(plotly) # install.packages('plotly')

# scatterplot (Note: key=country shows up on rollover)
s = ggplot(g, aes(x=gdpPercap, y=lifeExp, key=country)) +
  geom_point()
ggplotly(s)Your Turn: Expand the interactive scatterplot to include all the other bells and whistles of the previous plot in one continuous set of code (no in between setting of s).
4.1.3 Interactive: Exploding Boxplot
4.1.4 Interactive: Motion Plot
The googleVis package ports most of the Google charts functionality.
For every R chunk must set option results='asis', and once before any googleVis plots, set op <- options(gvis.plot.tag='chart').
## Creating a generic function for 'toJSON' from package 'jsonlite' in package 'googleVis'op <- options(gvis.plot.tag='chart')
m = gvisMotionChart(
gapminder %>%
mutate(
pop_m = pop / 1e6,
log_gdpPercap = log(gdpPercap)),
idvar='country',
timevar='year',
xvar='log_gdpPercap',
yvar='lifeExp',
colorvar='continent',
sizevar='pop_m')
plot(m)Your Turn: Repeat the motion chart with the country having the highest gdpPercap filtered out.
4.2 Map
Thematic maps tmap:
4.2.1 Static
library(sf)
library(tmap) # install.packages('tmap')
# load world spatial polygons
data(World)
# inspect values in World
World %>% st_set_geometry(NULL)
# gapminder countries not in World. skipping for now
g %>%
anti_join(World, by=c('country'='name')) %>%
arrange(desc(pop))
# World countries not in gapminder. skipping for now
World %>%
anti_join(g, by=c('name'='country')) %>%
arrange(desc(pop_est)) %>%
select(iso_a3, name, pop_est)
# join gapminder data to World
World = World %>%
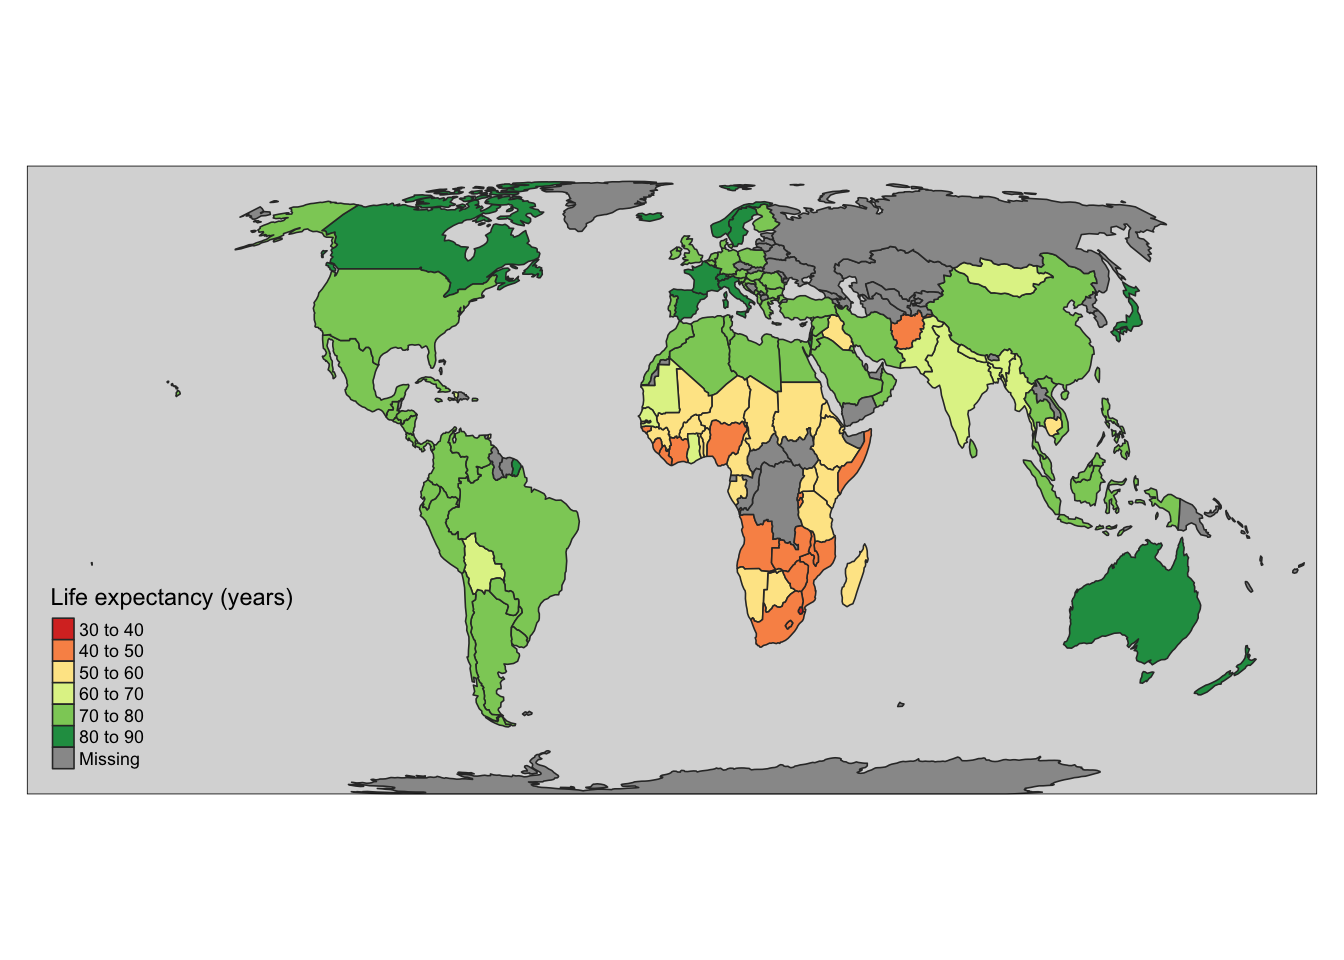
left_join(g, by=c('name'='country'))# make map
m = tm_shape(World) +
tm_polygons('lifeExp', palette='RdYlGn', id='name', title='Life expectancy (years)', auto.palette.mapping=F) +
tm_style_gray() + tm_format_World()## Warning: The argument auto.palette.mapping is deprecated. Please use
## midpoint for numeric data and stretch.palette for categorical data to
## control the palette mapping.## Warning in tm_style_gray(): tm_style_gray is deprecated as of tmap version
## 2.0. Please use tm_style("gray", ...) instead## Warning in tm_format_World(): tm_format_World is deprecated as of tmap
## version 2.0. Please use tm_format("World", ...) instead